
Cost volume profit analysis (CVP) examines the relationship between costs, sales volume, and profit to help businesses understand their “break-even” point. It answers practical questions like: How many units do we need to sell to cover all our costs? By separating costs into fixed and variable components, CVP allows managers to predict how changes in prices or volume will impact the bottom line.
At its core, CVP analysis rests on one powerful concept: the contribution margin – what’s left from each sale after variable costs are covered, which goes toward paying fixed costs and generating profit.
Key CVP Terms and Formulas
| Term | Formula | What It Means |
|---|---|---|
| Contribution Margin (CM) | Selling Price − Variable Cost | What each unit contributes toward fixed costs and profit |
| CM Ratio | CM / Selling Price | Percentage of each revenue dollar that contributes to profit |
| Break-Even Point (units) | Fixed Costs / CM per unit | Units needed to cover all costs; zero profit |
| Break-Even Point (dollars) | Fixed Costs / CM Ratio | Revenue needed to break even |
| Target Profit (units) | (Fixed Costs + Target Profit) / CM per unit | Units needed to hit a specific profit goal |
| Margin of Safety | Actual Sales − Break-Even Sales | Buffer between current sales and the break-even point |
Worked Example
A company sells a product at $50 per unit:
- Variable cost per unit: $30
- Fixed costs (monthly): $40,000
Contribution Margin = $50 − $30 = $20 per unit
CM Ratio = $20 / $50 = 40%
Break-Even Point (units) = $40,000 / $20 = 2,000 units
Break-Even Point (dollars) = $40,000 / 0.40 = $100,000 in revenue
To earn $20,000 profit: ($40,000 + $20,000) / $20 = 3,000 units
The Break-Even Chart
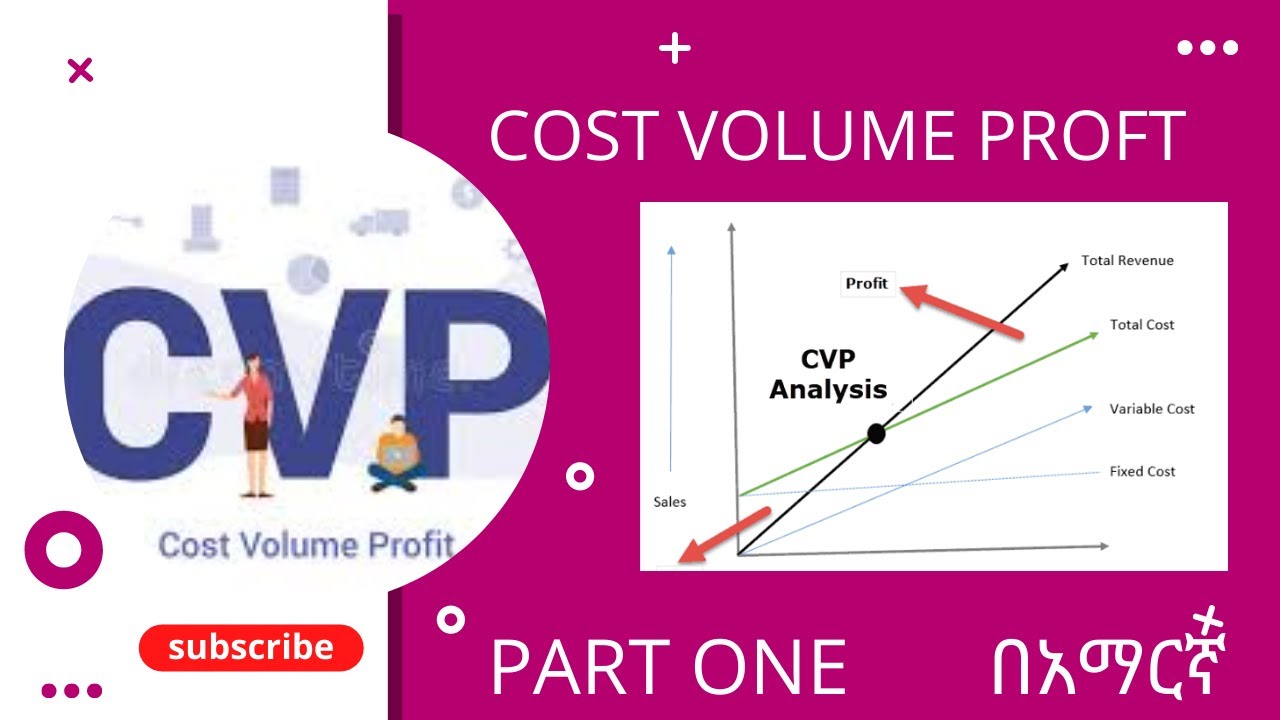
Imagine a simple graph:
- X-axis: Units sold
- Y-axis: Dollars (revenue and costs)
- Total Revenue line: Starts at zero, rises with each unit sold
- Total Cost line: Starts at the fixed cost level, rises with variable costs
- Break-even point: Where the two lines cross
Below the break-even point = losses. Above it = profits. The steeper the revenue line relative to the cost line (high CM ratio), the faster you move into profit territory.
How CVP Changes With Different Scenarios
| Change | Effect on Break-Even |
|---|---|
| Increase selling price | Break-even point decreases (fewer units needed) |
| Decrease variable cost | CM increases; break-even decreases |
| Increase fixed costs | Break-even point increases |
| Decrease fixed costs | Break-even point decreases |
| Lower selling price | CM decreases; break-even increases |
Multi-Product CVP Analysis
When a business sells multiple products, use the weighted average CM ratio based on the sales mix:
If Product A (60% of sales, 45% CM ratio) and Product B (40% of sales, 25% CM ratio):
Weighted average CM ratio = (0.60 × 0.45) + (0.40 × 0.25) = 27% + 10% = 37%
Break-even revenue = Fixed Costs / 0.37
CVP Assumptions (And Their Limits)
CVP analysis works within important assumptions:
| Assumption | Real-World Limitation |
|---|---|
| Costs are either purely fixed or purely variable | Many costs are semi-variable (e.g., utilities) |
| Selling price is constant | Volume discounts and pricing changes are common |
| Production equals sales | Inventory changes affect the analysis |
| Single product or fixed sales mix | Mix shifts constantly in real businesses |
CVP is a planning tool, not a perfect predictor. Use it for directional insights and scenario testing, not precise forecasting.
The Bottom Line
Cost volume profit analysis gives businesses a clear picture of the relationship between their cost structure, volume, and profitability. Know your contribution margin, know your break-even point, and you can make faster, more confident decisions about pricing, cost management, and growth targets. It’s one of the most practical analytical tools in all of management accounting.
